Finance leaders usually frame the ERP question as a choice between a known cost and an unknown one. The legacy platform is paid for, more or less. The replacement is a line item with a six-figure prefix and a two-year calendar. On that framing, staying wins. It almost always wins, right up until the moment the stack of tools wrapped around the legacy system is counted honestly.
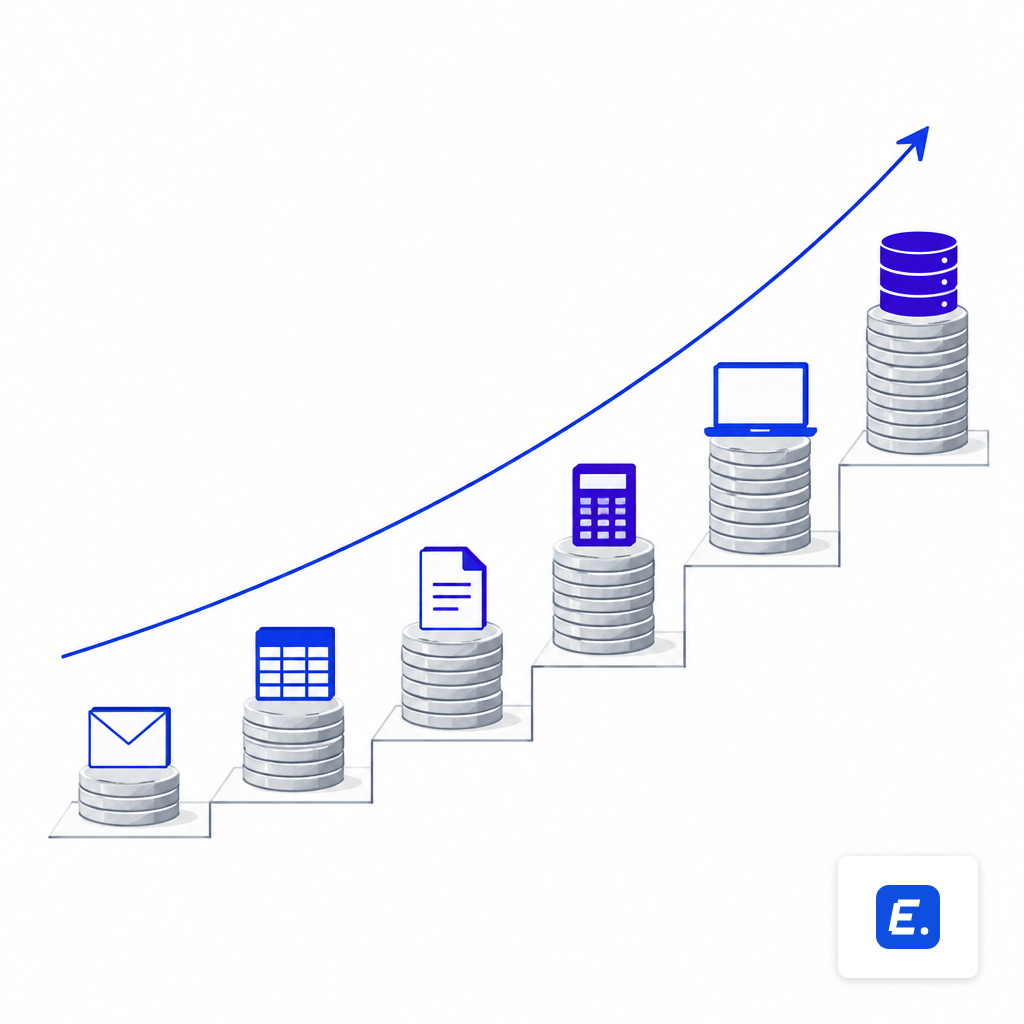
The "cheaper to keep" math works for a year. It breaks around year two, and by year three it has usually inverted. The reason is not the ERP itself. It is the OCR vendor, the close tool, the reconciliation tool, the revenue tool, the iPaaS layer that stitches them together, and the people hired to keep that assembly from drifting apart every month. Each line is defensible on its own. Added up and compounded, they become the most expensive part of the finance function.
So the question is not whether a replacement is expensive. It is whether the current path is more expensive, measured over the horizon a controller is actually responsible for.
What Is Actually in the Legacy ERP Line Item
The ERP contract is only the headline. The real spend sits in the ring of third-party ERP tools around it, each one bought to patch a workflow the ledger does not run end to end.
- AP automation. BILL and Tipalti anchor the mid-market, with per-user subscriptions ranging from $0 on Ramp's free tier to $89 per user per month on BILL's Corporate plan, plus transaction fees. Independent analyses put Tipalti or AvidXchange between $25,000 and $40,000 in year one once implementation is counted.
- Close and reconciliation. Enterprise close platforms are a line item of their own. BlackLine averages $77,000 annually, ranging from $36,000 to $340,000-plus, with implementation adding $5,000 to $50,000-plus. FloQast runs materially less at the entry tier but still sits in the five figures for a mid-market deployment.
- Integration middleware. This is the quiet one. A single native integration takes roughly 150 hours to build and 300 hours per year to maintain, at $50,000 to $150,000 per integration annually. MuleSoft Anypoint typically starts at $50,000 to $150,000 per year for enterprise tiers before implementation.
- Headcount to run the stack. Integration specialists command salaries of $90,000 to $140,000 per year, and the close platforms require named administrators on top of that.
None of this is wasted. Each tool was bought to solve a real workflow gap. The problem is that the gaps multiply, the tools do not consolidate, and the maintenance curve is not flat.
Year One Is Where the Argument Looks Strong
In the first twelve months, retention is unambiguously cheaper. A replacement project burns cash before it returns any. Industry research is consistent on this: a mid-market ERP migration typically costs $250,000 to $1 million in the first year, with ongoing annual costs of $75,000 to $200,000 after that. A mid-size ERP switch typically takes 6 to 18 months, with productivity dropping 15 to 25 percent during the first 3 to 6 months. Those are real numbers. They are also the ones every incumbent vendor leans on when the renewal conversation starts.
What the comparison usually leaves out is the counterfactual slope. Keeping the legacy platform is not a flat line.
The uplift mechanics are published. SAP's default posture at renewal is to repeat the prior contract with a 5 to 7 percent uplift, and a 6 percent annual increase doubles a support line in roughly twelve years. On Oracle, the 2026 spread shows uplift landing at 4 to 8 percent on cap-protected contracts versus 7 to 12 percent on uncapped ones, with roughly 44 percent of estates being uncapped, where Oracle defaults to an 8 percent annual uplift. The close platform renews with its own escalator; close software renewals commonly run 4 to 6 percent annually as new features launch. Middleware prices track usage, which trends up as the integration surface grows.
The Curve Inverts Around Year Two
Year two is where the retention math stops being obvious. Three things happen at once.
First, the uplift stack compounds. A finance function paying $300,000 across ERP support, a close platform, an AP tool and middleware is not paying $300,000 next year. At a blended 6 to 8 percent, it is paying closer to $320,000, then $345,000, then $370,000, before any new modules are added. None of that spend buys a new capability. It buys the right to keep running the ones already in place.
Second, the integration surface grows faster than the business. Every new entity, bank, tax jurisdiction or ERP module adds connectors, and connectors have maintenance. Annual maintenance adds 20 to 35 percent of the original build cost, and projects commonly exceed initial estimates by 40 to 60 percent. The custom fields and bolt-ons added to make the legacy ERP fit the business become, in our own earlier framing, ERP debt that compounds faster than custom code.
Third, headcount hardens. Once two integration engineers and a close administrator are on the org chart, they are not coming off. The variable cost has become a fixed cost, and it reports to IT rather than finance.
By the end of year two, the bolt-on stack for a mid-market finance function typically clears $600,000 in annualized run cost. By year three, it is often north of $750,000 before counting the ERP itself. That is the baseline the replacement case has to beat, not the first-year sticker.
The Replacement Side Has Its Own Honest Risks
None of this means switching is safe. The failure rate on ERP projects is high enough that any serious piece on ERP total cost of ownership has to name it. An audit of 640 finished ERP projects found that only 32 percent came in within budget and only 27 percent hit their planned go-live date, with IDC separately reporting that 75 percent of ERP deployments experience significant delays. The West Sussex County Council swap from SAP to Oracle Fusion ballooned from £2.6 million to nearly £40 million and lost its original systems integrator along the way. These are not edge cases. They are the base rate.
The lesson is not to avoid the switch. It is to design the switch in a way that lets it fail safely. That is the full argument for a rollback condition rather than a go-live date, and for treating the chart of accounts migration as a design job rather than a copy job. A replacement project without those controls is how a £2.6 million budget becomes £40 million.
What a Defensible Switch Sequence Looks Like
The point of modeling TCO is to earn the right to a decision, not to pretend the decision has no risk. For finance-systems consolidation to pay back, the sequence has to be legible to the audit committee before it starts.
The through-line is that AI-native ERP migration is only worth the disruption if it collapses the bolt-on stack rather than adding to it. An agent-native ledger that still needs a separate close tool, a separate recon tool and a separate AP tool has not solved the TCO problem. It has moved it.
- 11. Baseline the current stackInventory every bolt-on, integration and admin FTE wrapped around the legacy ERP · A single run-cost number the CFO will sign
- 22. Redesign the chart of accountsTreat COA as a design job, not a copy job from the old ledger · Mapped COA reviewed by audit and tax
- 33. Pick a consolidating targetFavor platforms that collapse close, recon and AP into the ledger · Bolt-on count is lower after, not higher
- 44. Parallel run with reconciliationBoth systems close the same period; variances explained line by line · Two clean closes in a row, tied to the penny
- 55. Cutover with a rollback conditionNamed conditions that trigger reverting, not a fixed go-live date · Rollback plan tested, not just written
- 66. Decommission the bolt-onsTurn off the tools the new ledger replaced; release the seats and the admins · Renewal line items actually removed from the budget
Where the Decision Actually Sits
The honest version of the retention case is that it works for one more year, and then it compounds against the finance function at 6 to 8 percent on each line, with headcount attached. The honest version of the replacement case is that it is a 12 to 18 month project with a non-trivial failure rate, and the only defense against that is a cutover plan with a rollback condition and a reconciled parallel run.
Those are the two risks. The right question is not which one is smaller. It is which one a controller would rather own in year three, when the bolt-on stack has grown another layer and the renewal letter has another uplift on it. The keep-versus-replace analysis gets easier, not harder, the longer it is deferred, because the retention line keeps climbing. That is the inversion. It is already underway.